


钓鱼统计信息 + 电子表格【开发中】
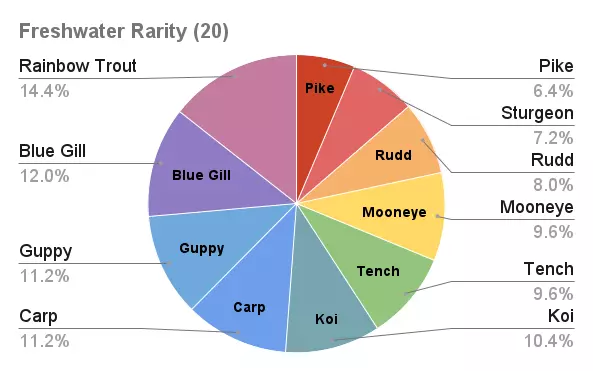
你是否想知道游戏中真正最稀有的鱼是什么?哪种鱼饵能带来最大收益?每条鱼的价格是多少?鱼饵、鱼竿和浮漂真的有用吗?这里有一份关于《On-Together》钓鱼世界的深入分析!数据来自数千次捕鱼记录,涵盖不同鱼饵和鱼竿,为你解答所有想在钓鱼上钻研的问题!请注意,英语并非我的强项,所以尽管数据看起来很深入,但我的文字解释可能在“深度”方面有所欠缺。 简介 首先要大力感谢:我当时正在悠闲地玩游戏,然后在游戏里遇到了Baiz。他们说他们正在收集这款游戏中所有钓鱼相关的数据,记录下鱼的价格、稀有度以及钓到这些鱼所使用的鱼饵。我获得了访问他们制作精美的表格的权限,这激发了我对其进行深入分析的想法。从那时起,我熬夜到凌晨3点,将Baiz的数据输入到新表格中,并制作公式来计算所有收集到的重要数据,以了解虚拟鱼类的各种细节。 这份电子表格组织和格式都非常清晰,希望能让大家轻松理解。如果你想查看我们收集到的所有详细数据和样本,可以看看这份表格!表格上的原始数据当然比其他任何信息都更新及时,你也可以自己进行分析!“一起钓鱼”数据统计表 “我不想点你的表格链接>:(” 行!不点就不点!我把所有内容都放到这个指南里,方便你直接查看,不用再去那个有更详细信息和各种数据的谷歌表格了>:T 总之,侧边栏有目录,方便理解。 我会深入分析目前收集到的各项数据,以及这些数据如何影响你的钓鱼玩法,让你能向朋友们炫耀钓到的各种稀有传说鱼!毕竟谁不喜欢炫耀呢!>:3c ┠--- 鱼竿与浮漂 这部分的数据没那么复杂!你可能会问“鱼竿有什么用?”然后接着问“浮漂又有什么用?” 好的!在这里寻找答案吧,因为你即将找到! 鱼竿的攒钱购买成本可能相当高,但问题是:它们到底有什么用,值得你花费门票去购买吗? 简单来说,答案是肯定的。升级后的鱼竿值得入手,因为随着升级,它们会让你的钓鱼小游戏变得更简单。不过,如果你已经能轻松通过小游戏来钓取更大的传说级或神话级鱼类,那么可能就没必要一路升级到5000门票的红色“梦想”鱼竿了。更详细的解释如下: 鱼竿越贵,小游戏就越简单。虽然用默认的绿色“伙伴”鱼竿或许能轻松钓到普通、稀有甚至史诗级别的鱼,但面对更珍贵的传说级和神话级鱼类时,你可能会很难跟上所需的点击速度,导致它们逃脱。 鱼竿会减少钓到鱼所需的初始点击次数,同时也会降低鱼对抗你点击的力度。 如果你想知道“鱼怎么对抗?”那么你可能已经注意到,当你快速点击以填满圆形进度条来捕鱼时,这个圆圈同时也在尝试缩小!这是鱼在“反击”试图逃脱。 举个例子:如果你用绿色鱼竿钓传说级的古巴鲷鱼,当小游戏的快速点击阶段开始时,计数器会从需要点击18次开始!但如果你用橙色的“探索者豪华版”鱼竿(第二贵的鱼竿),开始时可能只需要点击12次。这看起来可能没太大差别,但使用低等级鱼竿的真正挑战在于鱼的反击力度! 使用绿色鱼竿时,小游戏大约需要你每秒多点击5次才能跟上鱼的速度!这对有些人来说可能还行,但即使是那些能做到的人,钓几条传说级或神话级的鱼后,手也可能会酸痛。不过,使用橙色鱼竿的话,你每秒只需多点击2-3次,尤其是如果你点击速度不是很快的话,这累积起来的效果会很明显! 好的!这倒是个有用的信息!不过浮漂又怎么样呢? 好在浮漂的说明要简单得多!浮漂完全是装饰性的,购买它们没有任何机制上的加成,但能为游戏增添一点有趣的个性!谁不喜欢多一点自定义选项呢? 【鱼饵概率】 那么鱼饵到底有什么用呢?这张图表已经尽可能清晰地展示了。
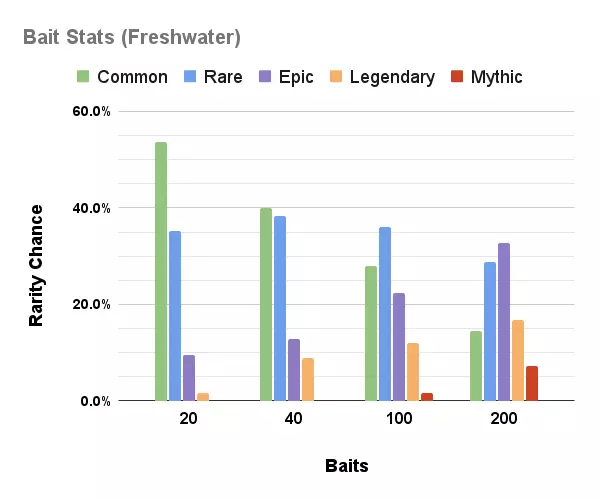
每种鱼饵的样本量为125条,总样本量为500条鱼。 文字说明: 鱼饵价格越高,获得史诗、传说和神话品质鱼类的几率就越高,而获得普通和稀有品质鱼类的几率则越低。 对于神话品质鱼类,大多数鱼饵的获取几率基本为0%,但【糖果手杖鱼饵(200)】除外,它能将几率大幅提升至7.2%。 【马卡龙鱼饵(100)】也能钓到神话品质鱼类,但几率较低,仅为1.6%。 完整的统计数据和百分比可在电子表格中查看,以获取具体且最新的数值。 ┠--- 淡水鱼
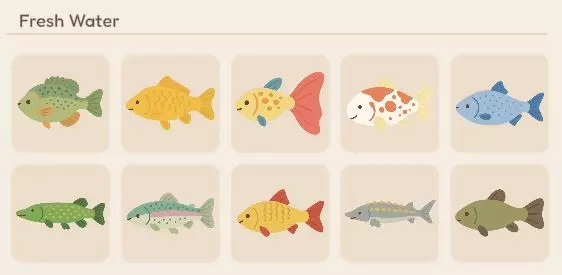
你肯定明白我为什么从这里开始了!少量的鱼加上几乎没有垃圾,这简直是完美的可控样本量,能让我一开始就不至于累垮!哈哈。 关于接下来的所有内容,你必须知道: 样本量为500条,也就是每种鱼饵对应125条鱼。 从整体来看,这个样本量其实不算大,实际上相当小。而且我甚至还没收集到所有的传说级淡水鱼! 那么,真正最稀有的鱼是什么呢?这里有一个大大的饼图,展示了最常见和最不常见的淡水鱼。不过这些数字不算大,所以差异可能不太明显。
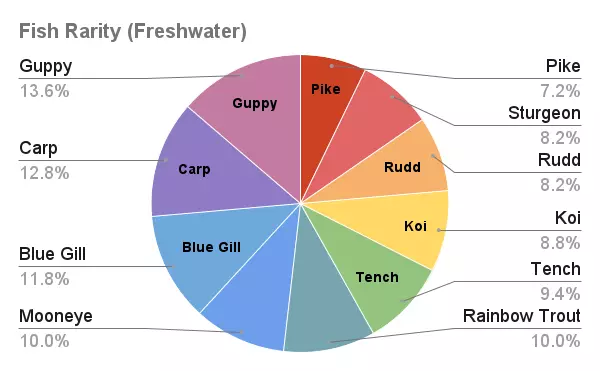
最常见的淡水鱼是孔雀鱼!上钩概率为13.6%! 而最稀有且最害羞的淡水鱼是梭子鱼!上钩概率仅7.2%! 如果你看到有人在池塘钓到一条传说级梭子鱼,那可是相当稀有的!尤其是当他们使用廉价鱼饵时! 不过话说回来,我还缺少传说级的孔雀鱼、锦鲤、鲟鱼和虹鳟鱼。所以我觉得梭子鱼并非最稀有的鱼,至少在传说级鱼类中不是。 哪种鱼最值钱呢?这里有一张图表展示了每种鱼的平均价值!请注意,这忽略了捕获它们时使用的鱼饵。按上述整体稀有度排序。
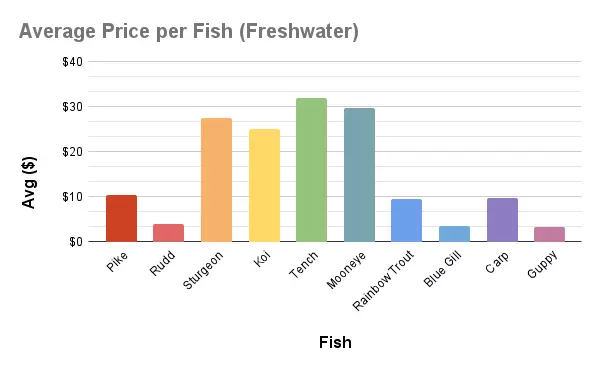
我们最昂贵的鱼是美妙的丁鱥,平均价格为32美元。而最便宜的鱼是声名狼藉的孔雀鱼,平均价格仅3美元。但每种鱼对应每种鱼饵的稀有度如何呢?很高兴你问了这个问题,因为我们说过要深入分析。 橄榄鱼饵(20): 最常见:虹鳟鱼,占比14.4% 最稀有:梭子鱼,占比6.4%
玉米糖鱼饵(40)最常见: 最稀有: 。 马卡龙鱼饵(100)最常见: 最稀有: 。 拐杖糖鱼饵(200)最常见: 最稀有: 但每种鱼饵类型中鱼类的价格范围和最常见价格是多少呢? 如果没有电子表格,这些图表可能会有点令人困惑,但如果你学过初中数学,这里有一些基础知识。所有图表都是按照之前显示的稀有度顺序排列的。 (这些图表让我意识到我应该用Excel而不是谷歌表格重新制作它们)
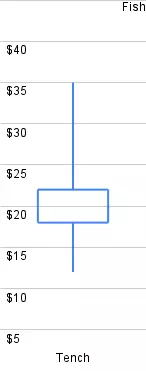
这是一张蜡烛图。 我没有将其用于预期用途。 蜡烛图包含最高价(线的顶端)、开盘价(方框的顶端)、收盘价(方框的底端)和最低价(线的底端)。 对于我的数据,我将最高价设为使用该鱼饵捕获的最大值,最低价设为使用该鱼饵的最小值,开盘价使用该鱼饵类别中鱼类的平均值,收盘价设为众数,即出现次数最多的数值。 示例:丁鱥(20) 线的顶端为最高价:36美元 开盘价即平均价格:22美元 收盘价即最常见价格:18美元 线的底端为最低价:12美元 橄榄鱼饵(20)
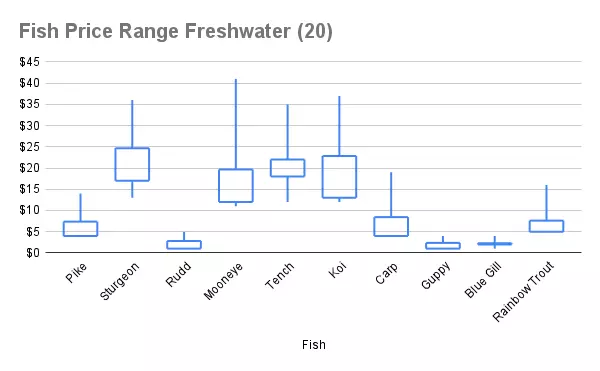
Biggest difference (between Average and Mode): Koi at a difference of 10 Smallest difference (between Average and Mode): Blue Gill at a difference of 0 . Candy Corn Bait (40) Biggest difference: Smallest difference: . Macaron Bait (100) Biggest difference Smallest difference . Candy Cane Bait (200) Biggest difference Smallest difference ┖--- Salt Water Fish & Trash [W.I.P] Just a little piece from me (Baiz) so that our saltwater fish section isn't entirely empty at the moment! I decided to open up my fishing journal and record how many of each fish I had caught into a spreadsheet (ignoring bait types used, this is just how many of each fish I have ever caught) so that I could get estimates on the percentage chance for each type of fish or trash to appear. My original suspicion was that trash has a lower chance of appearing than fish, and I was unsure whether different fish would have different probabilities of being caught. After entering all of the numbers I discovered that at the time, I had caught 5417 saltwater fish/trash, which makes for a pretty good sample size to make some estimates from. I'll drop a couple of lists for comparison below. Most Common Fish: 1. Bluefish - 114 Caught (2.1%) 2. Bluehead Wrasse - 112 Caught (2.07%) 3. Oilfish - 111 Caught (2.05%) 4. Firefish Goby - 108 Caught (1.99%) 5. Squid / Clown Triggerfish - 106 Caught of Each (1.96% each) Least Common Fish 1. Ocean Sunfish - 68 Caught (1.26%) 2. Atlantic Tarpon - 75 Caught (1.38%) 3. Raccoon Butterflyfish - 80 Caught (1.48%) 4. Banggai Cardinalfish / Gag Grouper / Mahi-Mahi / Pajama Cardinalfish / Porcupine Fish - 81 Caught of Each (1.50% each) Most to Least Common Trash: 1. Missing Shoe - 59 Caught (1.09%) 2. Pearl - 54 Caught (1.00%) 3. Tin Can - 50 Caught (0.92%) 4. Plastic Bottle / Key - 48 Caught of Each (0.89% Each) 6. Banana Peel - 47 Caught (0.87%) 7. Hanger - 42 Caught (0.78%) 8. Eaten Apple - 38 Caught (0.70%) 9. Milk Box - 35 Caught (0.65%) 10. Soda Can - 32 Caught (0.59%) The fish stats show variance from 2.1% to 1.26% (0.84% difference), compared to Trash, which has a high of 1.09% and a low of 0.59% (0.50% diffference), I think a conclusion can be drawn that Trash does in fact have a lower chance to be caught. However, the question lies: 'Do different fish have different chances of being caught?' Despite the variance of 0.84% from the most to least common fish, and 0.50% for trash, I don't believe different fish have different probabilities to be caught. Well, I decided to average the numbers out between the fish and trash (91.64% for 55 fish & 8.36% for 10 trash) which left me with an average of 1.666% per fish and an average of 0.836% per trash, and if we compare these to the highs and lows of each this is what we can see: Fish: 2.10% High (0.434% Above Average) 1.666% Average 1.26% Low (0.406% Below Average) Trash: 1.09% High (0.254% Above Average) 0.836% Average 0.59% Low (0.246 Below Average) It is apparent that the highs and the lows of each the fish and the trash are not too crazy compared to the averages, which is what you would expect if you didn't have any incredibly wild outliers (though the Bluefish at 2.1% is a bit out there, it is followed by others at 2.07% and 2.05%). My conclusion on this is that we are probably looking at between 1.64% to 1.67% for each fish to appear, and 0.98% to 0.82% for each trash item to appear, and the variance is just what would be expected from any normal set of data, which, though I know there are probably ways to determine the p-value or accuracy for this data and outcome, I am not quite willing to re-educate myself for a steam guide on some digital fish! If you draw any other conclusion from this, feel free to drop a comment as i'd love to hear your thoughts, as this was just a quick little piece I wanted to do to fill the space for now! FAQ and TLDRs You have questions. I will do my best to answer them all here. Starting off with the most common one. What Bait is the best cost-wise? Candy Corn babyyy! At 40 tickets per 10 bait, it'll usually take between 2-3 saltwater fish, or 3-4 freshwater fish to cover the cost of all 10 bait. However, if you are lucky, you can sometimes get your money back with just 1 of the 10 fish you catch! An Epic Giant Trevally can pay you back for all 10 bait you bought, and there's almost enough extra to pay for another 10 too!
2026-02-14 10:00:09 发布在  On-Together: Virtual Co-Working


说点好听的...
收藏
0
0